DD
Analysis
MRP and DDMRP inventory simulation and optimisation

Supply chains are complex, and controlling inventory without taking on risk has become critical. Yet we keep thinking locally.
DD Analysis made a cross-functional view possible, beyond company silos: simulate the whole network before touching real parameters, then compare inventory policies to find the best trade-offs between availability, stock and risk across upstream, downstream and internal operations.
The problem is a network problem
Conceptual diagram, without real dataSupplier
A lead time or a received quantity drifts from the plan.
Plant
Bills of materials and network levels absorb or pass on the gap.
Warehouse
Cutting stock here may simply move the problem elsewhere.
Store
Demand varies, and peaks travel back up the chain.
lab
A decision lab for the supply chain
I built a C# simulator able to reproduce, day after day, how a multi-level supply chain behaves.
Four capabilities of the simulator
How it was delivered
A web interface let users upload their data, run the calculations and retrieve the results.
The simulator was therefore not an analysis script: it shipped as a tool usable within an engagement.
 Inspect
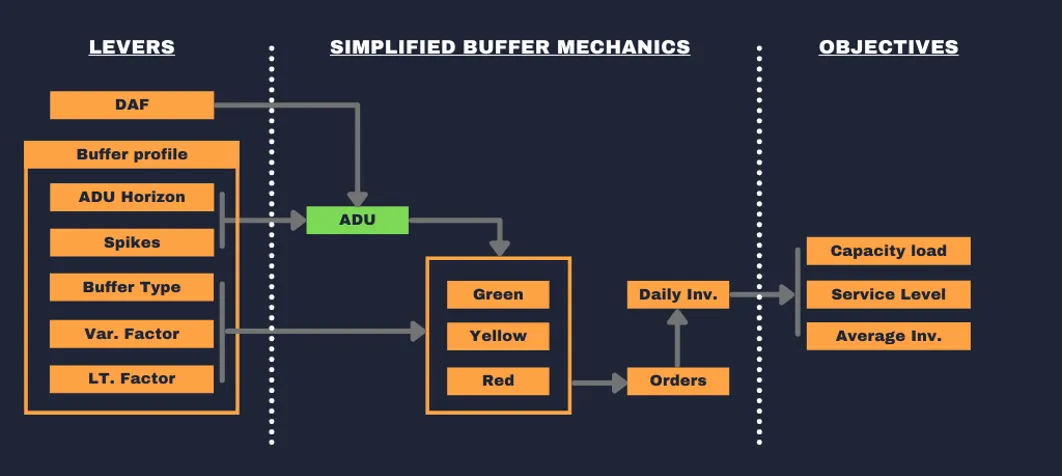
 DD Analysis connected the configuration levers to the buffer calculation rules, then to the tracked objectives: service level, average stock and workload.
Original diagram from the project.
evidence
Comparing before changing the real system
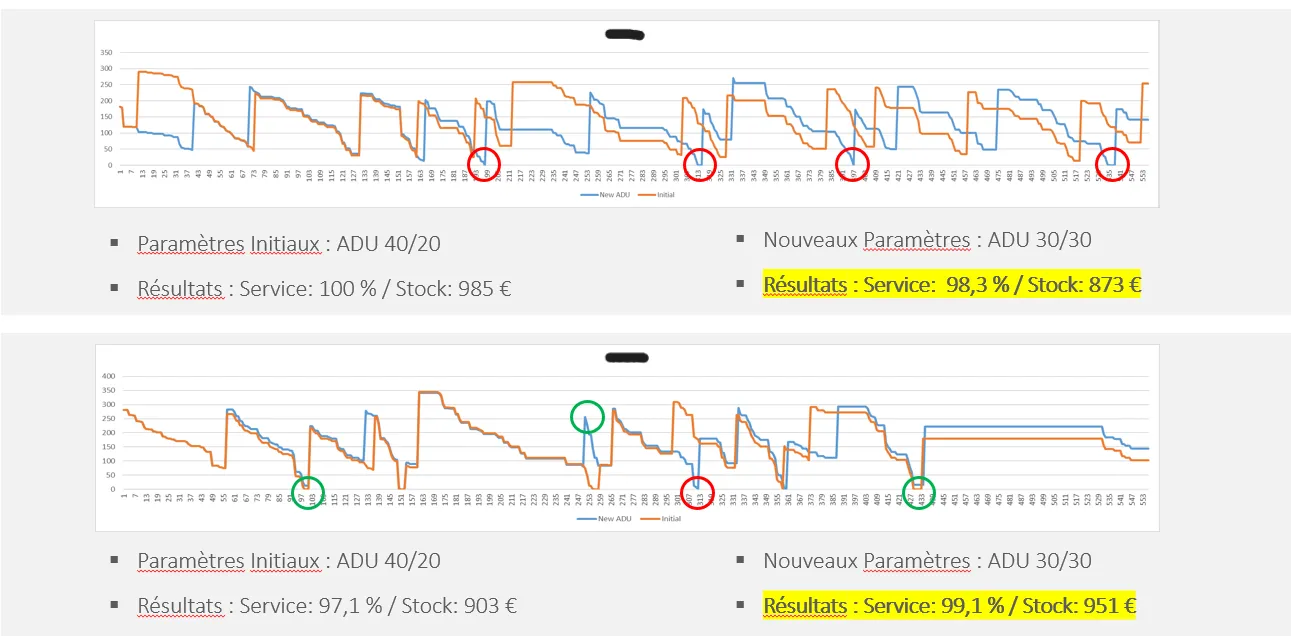
On a real network, a parameter is rarely set once. Simulation showed the effect of a setting before applying it.
 Inspect
 Two seemingly close settings can produce very different inventory trajectories and stockouts. The simulator made those effects comparable before changing the real system.
Project archive, with data and curves kept as they were.
on the market
A product that was genuinely sold
For eighteen months I defined the value proposition, built the product and its algorithms, prospected, sold the solution and delivered the engagements with paying clients.
Price charged per optimisation
An accessible price, but too low against the work required and the potential value for clients.
Average inventory-reduction target
An average target, alongside fewer delays. Not a universal guarantee, nor a certified result for every client.
That price made the solution easy to reach. In hindsight I had undervalued the offer: I wanted it accessible to as many as possible, but that very idealistic positioning could not sustain a business.
A useful solution also has to be priced and sold in line with the value it produces.
case
Results and analysed case
A complete analysis deck exists in the project archive. Its figures are kept here as an analysed case, distinct from the average target of around 20%.
An analysed case kept with its limitation: its exact context still needs documenting.
These figures are neither an average nor a promise of results.
Three statuses not to be confused
- Target
- ≈ 20% inventory reduction aimed for on average.
- Scenario
- The figures of one analysed case, in its own context.
families
Grouping products by how they actually behave
In some planning processes, simply reorganising the planning families, without changing anything else in the system, can cut inventory by 5 to 10% at constant service level.
So I extended DD Analysis with a clustering tool that goes beyond ABC/XYZ classification: it analyses product characteristics and consumption history to identify which products should be managed in a similar way.
The real trade-off
Optimising product by product can give the best theoretical result, and create hundreds of rules that nobody can maintain day to day.
The goal is not only the mathematical optimum, but a recommendation the teams can actually apply.
Four terms of the trade-off
 Inspect
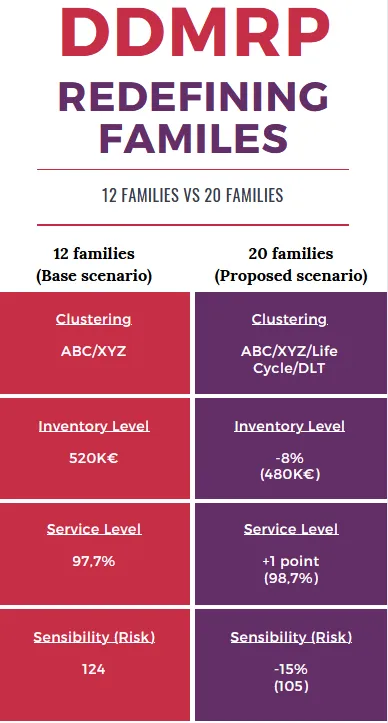
 In this scenario, a new family segmentation cuts inventory by 8%, improves service by one point and reduces the system’s sensitivity by 15%.
An analysed scenario, not a guaranteed average
 Inspect
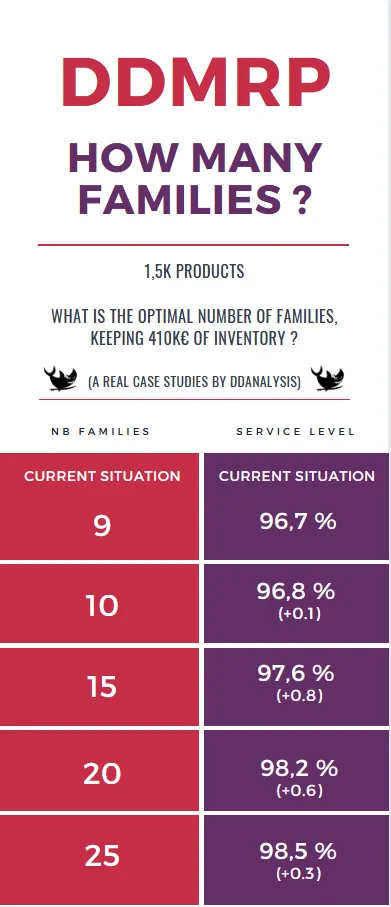
 More families improve performance step by step, but also increase the maintenance load for the teams.
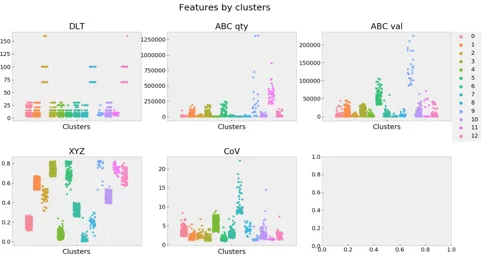 Inspect
 Products are grouped across several behavioural dimensions, beyond their ABC/XYZ class alone.
The clustering took product characteristics and their history into account, then proposed several family counts to compare.
to offer
From domain expertise to an offer that sold
DD Analysis was neither an academic exercise, nor a mere case study, nor development alone. The project brought six dimensions together.